Dutch
Spin-off Report




Scope: A relevant and workable spin-off definition for charting the Dutch ecosystem and measuring progress towards a national ambition.
Relevance: When a research ecosystem’s spin-off mechanism works successfully, startups with an academic origin can make an outsized contribution to society through:
- Productivity gains through new products/services
- Solving societal challenges, e.g. health, sustainability
- Contributing to technological sovereignty
4×Ambition: We posit that the Dutch ecosystem has room to increase its impact fourfold.
Progress: This can be achieved through:
- Increasing the volume of spin-offs, increasing the chances to create winners.
- Improving the quality of spin-offs, providing the resources for success.
- Improving the speed at which spin-offs operate to remain competitive.
Definition: in this report, we define a spin-off as:
“A scalable venture based on scientific results developed in a public research institute”
- A company designed to grow fast
- Based on research findings, often (but not necessarily) protected through IP
- Emerging from the (Technical) Universities, medical centres or applied research institutes.
Data spin-offs: Techleap Academic Venture Monitor | Data ecosystem: Dealroom. All data based on incorporations since 2010. Share of ecosystem based on operational companies.
Scope: differentiating between research discipline and technology types as helpful categories
- Spin-offs by research discipline. Dependent on the faculty from which they spin off, we distinguish four main categories: health sciences, engineering & agriculture, natural sciences and social science & humanities (SS&H). Important to note is that natural sciences includes a wide range of disciplines like physics, chemistry, mathematics, and computer science.
- Spin-offs by technology type.Deep tech spin-offs: companies based on engineering innovations or scientific advances and discoveries applied for the first time as a product.*Biotech spin-offs: companies developing new drugs and therapies based on chemical processes or derived from living organisms.**
* This definition follows Dealroom (2026). European Spinout Report. In practice we use Dealroom classification, when startups are labelled “Deep Tech” in technologies or tags. ** This definition follows the “Life Sciences” category in the Dealroom (2026). European Spinout Report. In practice we use Dealroom classification, when startups are labelled “BioTechnology” in sub-industries or tags. Data spin-offs: Techleap Academic Venture Monitor.
Only a fraction of high-potential research becomes a spin-off, leaving significant untapped potential
- Around 20% of yearly publications can be classified as having a high business potential. However, 90% of the findings described in these publications have a low technology readiness.
- Findings from a single publication alone are often not patentable, let alone sufficient to build a company on.
- It is also dependent on the willingness and ability of the researcher to step out of academia and whether the institutional and cultural context enables this.
* Includes everyone from PhD to professor at universities and UMCs. Sources: UNL & NFU. ** Based on Open Access publications and ScoutinScience prediction algorithm. Source: ScoutinScience.
Hypothesis: More ventures created each year means more shots at creating winners.
Volume: Researcher numbers have grown 28% since 2015 while spin-off output fell 2%, signalling a widening conversion gap in Dutch academia
Although the mass of the research ecosystem in the Netherlands has increased, the number of spin-offs created annually has not kept pace. Somewhere, conversion from scientific results to spin-off is stalling.
This is not inevitable. ETH Zurich has grown its researcher mass by 13% and its spin-off creation by 68% in the same time period.
Data spin-offs: Techleap Academic Venture Monitor | Data on researcher headcount: UNL (2025). Cijfers & Rathenau (2025). Het personeel bij de universitair medische centra - Factsheet. Excludes researcher headcount at TNO.
Volume: Spin-off creation from natural sciences is booming: output tripled since 2015 while health collapsed 58% and engineering & agriculture is stable but trailed its researcher headcount growth
Spin-off creation is not evenly distributed. Based on the scientific discipline of the founder, the trend has been markedly different for health sciences and engineering compared to natural sciences.
- Health science based spin-offs have declined strongly.
- Engineering & Agriculture still leads in volume and provides stable output, but trails researcher headcount.
- Natural sciences has outperformed its researcher growth.
Data spin-offs: Techleap Academic Venture Monitor | Data on researcher headcount: UNL (2025). Cijfers & Rathenau (2025). Het personeel bij de universitair medische centra - Factsheet. Excludes researcher headcount at TNO.
For more analysis on spin-off creation and volume benchmarks, read Part 3.2 of the full report.
Hypothesis: If we improve the quality of spin-off propositions and teams, ventures will grow faster and attract more funding.
Quality: 18% of spin-offs manage to raise 1M in private funding, 6% raise 10M. Spin-off firms focus more on deep tech and biotech, which attracts more funding interest
Although the spin-off funding rate is higher than average compared to the rest of the Netherlands, it is still lagging the rest of Europe up to twofold.
Data spin-offs: Techleap Academic Venture Monitor | Data ecosystem: Dealroom. All data based on incorporations since 2010.
Quality: Within the startup population deep tech spin-offs perform best when it comes to raising 1M & 10M: resp. 45% and 19% reach that milestone
Reaching these milestones is not equally distributed. Dutch deep tech spin-offs have better chances at raising capital than all other segments, even when compared to other deep tech startups.
Data spin-offs: Techleap Academic Venture Monitor | Data ecosystem: Dealroom. All data based on incorporations since 2010.
For more analysis on spin-off fundraising and comparative performance on funding milestones, read Part 4.2 of the full report.
Hypothesis: If the speed of creating and building spin-offs is increased, it improves chances at either gaining first-mover advantage or failing fast.
Speed: Time to €1M decreased from 42 to ~30 months after 2014, then stalled, even as the share reaching €1M climbed from 7% to 17%
The funding speed of spin-offs has improved markedly since 2010 in the share that reach €1M but not in the median months it takes to do so.
Data spin-offs: Techleap Academic Venture Monitor | Data ecosystem: Dealroom. Analysis based on incorporations between 2010 and 2021.
Speed: Biotech spin-offs reach €1M ~14 months faster compared to other segments, but reach this milestone less often than deep tech spin-offs
Biotechnology firms move fast to secure their first rounds, whereas deep tech firms take longer but the share of success is higher.
Non-technical or digital spin-offs have trouble raising funds within 5 years.
Funding speeds have improved over the years, but spin-offs in the Netherlands are slow to gain traction compared to international peers, with 8-13 months difference in medians in biotech and deep tech compared to the #1, Belgium.
Data spin-offs: Techleap Academic Venture Monitor | Data ecosystem: Dealroom. Analysis based on incorporations between 2010 and 2021.
For more analysis on spin-off fundraising and comparative performance on speed, read Part 4.2 of the full report.
Volume × Quality × Speed: Dutch spin-offs reach €1M in funding slower and relatively less often than most other countries
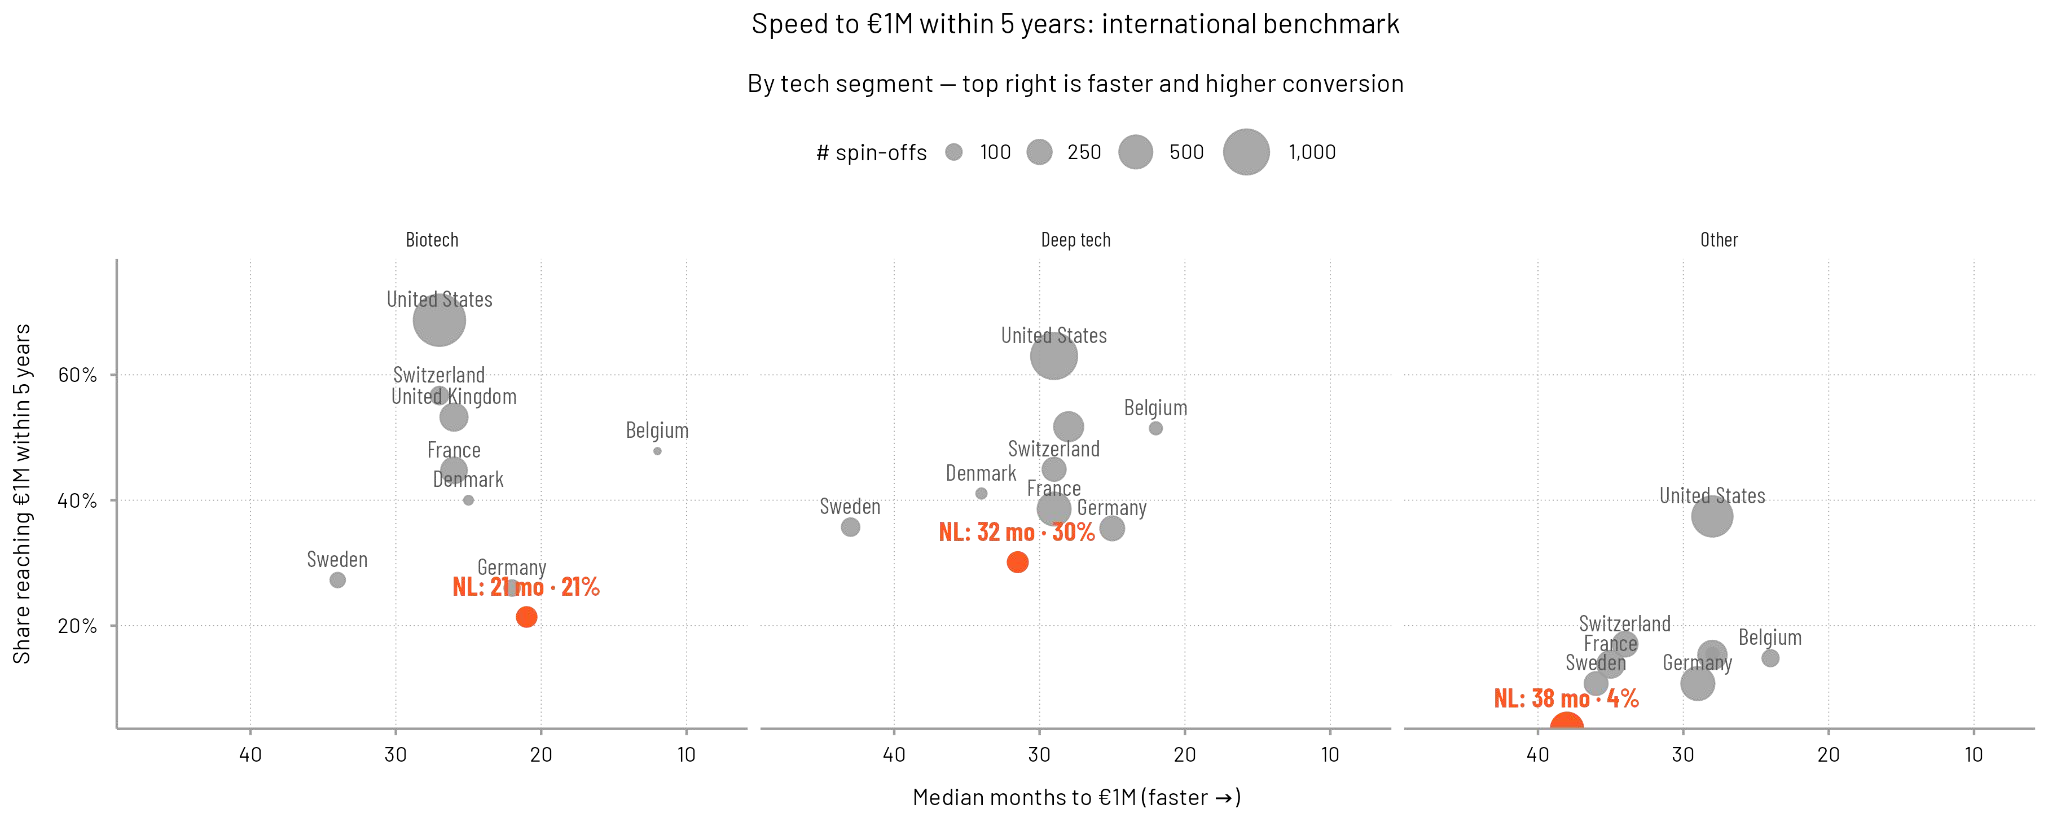
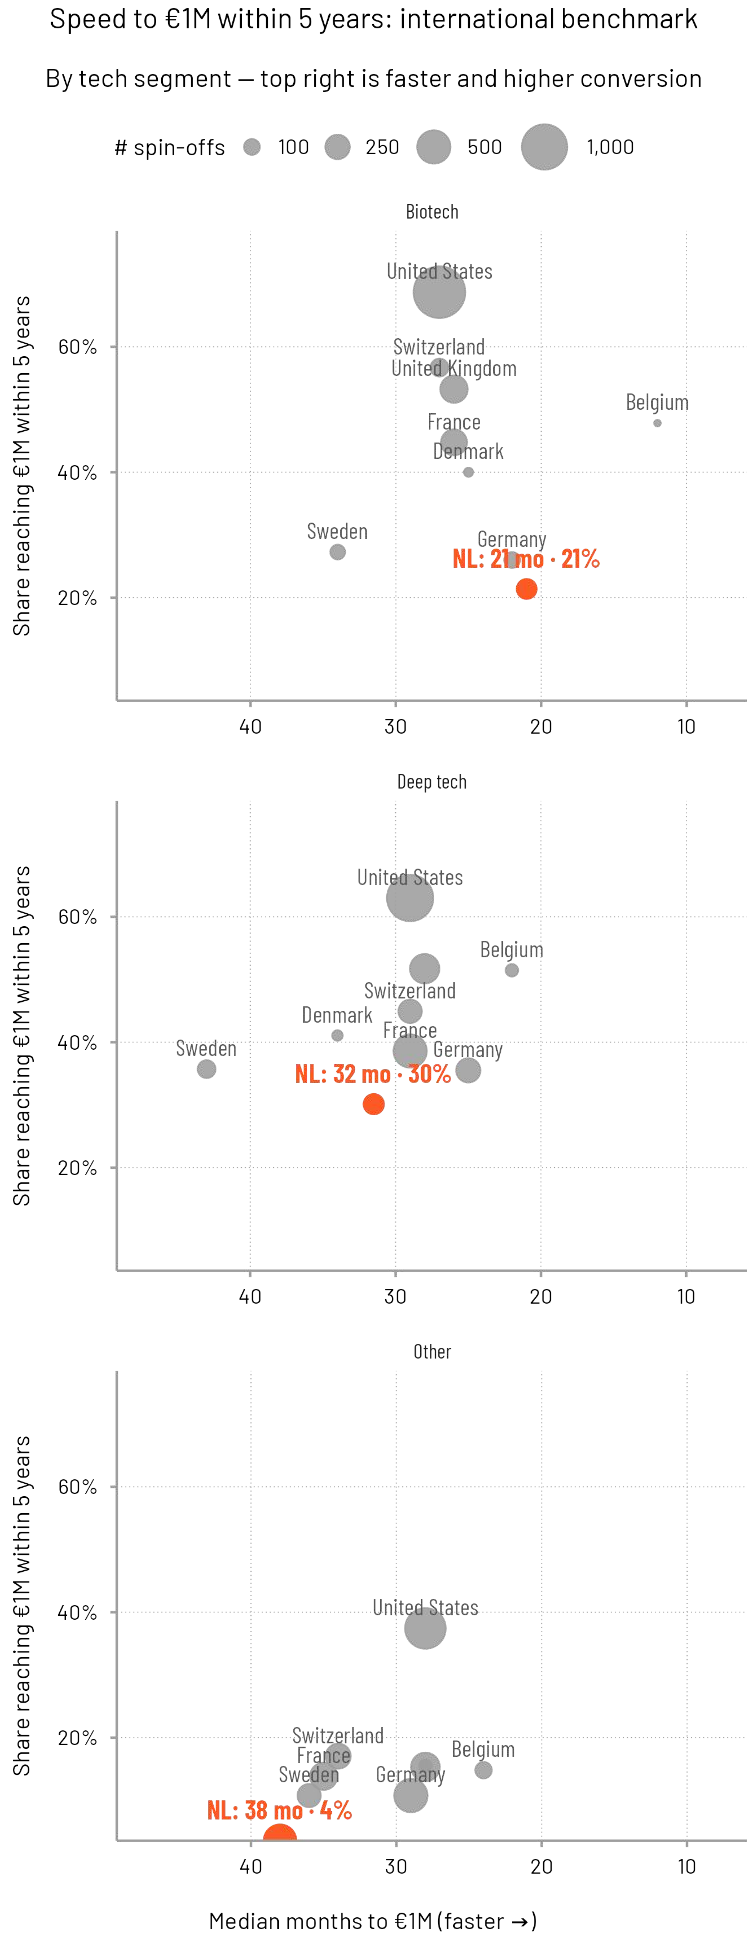
International data: Dealroom. Selected startups with the “spinout” tag. Nominal prices. Keep in mind that the buying power of a €1M funding round varies by city in terms of talent, real estate and compute. Funding data: Dealroom. Included are all venture capital related financial instruments. Analysis based on incorporations between 2010 and 2021.
Changing the game for Dutch spin-offs
Key takeaways: The Netherlands has room to improve on all cylinders for spin-off impact - volume, quality and speed can be increased to reach a 4× impact ambition
- Volume: the rate of spin-off creation trails the total growth of the Dutch research ecosystem. The expected increased conversion is not materialising.
- Quality: spin-offs are more likely to attract funding compared to other startups (especially in deep tech) but compared to other spin-off ecosystems internationally there is room for improvement.
- Speed: spin-off funding attraction speed has markedly improved, but differs greatly by segment and trails a full year behind the number 1 ecosystem.
Game changers
- A. Dutch scientific excellence is insufficiently converted to entrepreneurial efforts; there is probably a lot of latent potential that still goes unrecognised. It is time to experiment with new ways of finding and guiding excellent researchers towards entrepreneurship.
- B. Improving the learning environment for scientific founders, coupled with experienced entrepreneurs, will increase the quality of new spin-offs and increase their chances at attracting funding.
- C. Transparent and standardised processes for creating spin-off ventures will greatly increase the speed for scientific founders and their partners, and easier access to capital and markets.
Research agenda: identifying the bottlenecks in spin-off creation and performance
This report is part of a larger systematic effort to organise continuous monitoring, learning and streamlining of the Dutch spin-off ecosystem. We invite stakeholders to contribute to this research agenda and supply us with questions and data that we can take up together in the coming year.
Potential to increase volume
Can we identify on a sub-institute level where the loci of innovation are? Which faculty or research group creates more spin-offs than expected, and what are their best practices?
Characteristics of quality
What type of ventures are more likely to attract funding and grow fast? What are the technologies or industries that Dutch spin-offs excel in?
Performance and speed
What is the impact of intellectual property agreements on subsequent growth? What other factors influence the performance of spin-offs?
- Updating this report often to reflect the latest trends.
- Expanding our research efforts into new areas.
- Providing tailor-made regional spin-off intelligence to individual institutes.
- Creating a shared database for spin-offs in the Netherlands that is continually updated.
Definitions and delineations used in this report
Dutch startup ecosystem
Includes only Dealroom verified companies headquartered in the Netherlands, founded no earlier than 2010, with a status of low-activity or operational, and having a website. These companies have at least 1 employee, are not subsidiaries, nor publicly owned and operate within the tech domain. Non-profit organisations and service providers are excluded.
Spin-offs
Includes all scalable ventures based on scientific results developed in a public research institute, as reported to us by ecosystem partners.
Deep tech
To select deep tech ventures, we rely on Dealroom’s technologies and tags field, selecting all firms with a "Deep Tech" tag.
Biotech
To select biotech ventures, we rely on Dealroom’s sub-industry and tags field, selecting all firms with a "BioTechnology" tag.
Private investment
To calculate funding, we include the following rounds defined by Dealroom: ANGEL, CONVERTIBLE, EARLY VC, GROWTH EQUITY VC, LATE VC, MEDIA FOR EQUITY, NOT SET, PRIVATE PLACEMENT VC, SEED, SERIES A-I, SUPPORT PROGRAM, and exclude transactions from mature companies.
Employment
To calculate personnel we use the employment and fte history fields from Dealroom that provide an estimate of the number of full time equivalent employees at a company.
For how disciplines, company status and incorporation years are determined, see the annex of the full report.
Overview of contributing organisations












And many other representatives of the knowledge institutes themselves.
Data was collected from 2025 onward by Techleap from contributing organisations, then enriched by the Techleap team. This has resulted in a continuously updated dataset. Analysis in this report is based on the June 2026 set.
All the data in the world
Data sources used in this report




Techleap data team · Academic Venture Monitor
Which spin-off question should we answer next?
We are building a shared, continually updated database for Dutch spin-offs. If something in this report looks wrong for your institute, or there is an analysis you need, tell us - corrections and questions both feed the next edition.
Form not loading? Open it in a new tab →